Log2Stats Documentation
Contents
|
Report configurationThere are two types of reports in Log2Stats - standard reports and favorite reports: 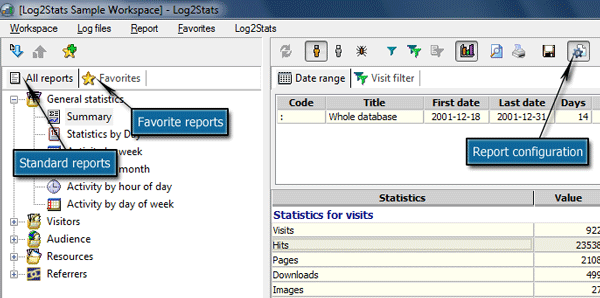
You can find what features can be configured in standard and favorite reports in the table below:
To add report to favorites select appropriate report in the "All reports" tab and use Report - Add to favorites menu command or corresponding button on the toolbar. You can add as many reports as you need and you can create any number of favorite reports of the same type, no limits there (except in the trial version). Each favorite report has it's own settings. Settings for standard reports are shared between all of them. General settingsBasic settings like report name, it's icon and description can be defined via General settings: 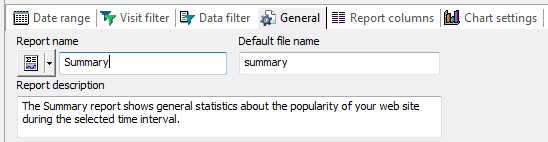
It is advised to give meaningful values in these fields. Date rangesYou can add up to 8 date ranges for each favorite report.
Click 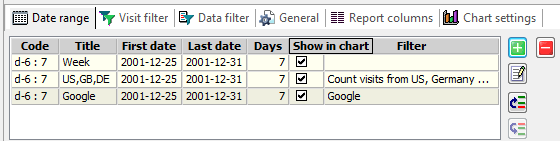
You define date ranges via the code field. There are two types of date ranges: direct and relative. Direct date range is a simple range between two fixed dates: 2001.12.01 - 2001.12.31 defines date range starting at 2001-Dec-01 0:00:00 1st and ending at 2001-Dec-31 23:59:59 Relative date range allows you to set up date ranges related to the date of the latest entries in the database. You can find syntax for relative date ranges here: Date Ranges - Manual You can right click on the code field to edit the selected date range, right click the Title field to select predefined date range, right click first or last date to directly select date range via calendar or right click on the Filter field to apply instant filter to the selected date range. Visit filterAlmost all reports in Log2Stats are generated by selecting visits (or sessions) which where active during the selected date range. You can use instant filters to control which visits will be selected for reporting. There are a lot of parameters you can filter by, complete list and explanation can be found here: Instant filters - Manual 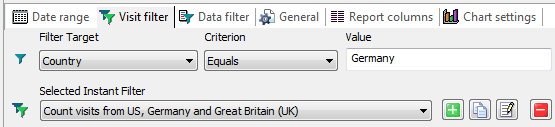
Instant filters can be used to refine web site statistics in individual reports (both standard and favorite), date ranges in favorite reports, directories in favorite reports (filter applies to all reports in that directory). As you can see on the screenshot above, you can apply two filters to the report. Quick filter allows to refine report by a single parameter only. I.e. "Country equals Germany" will show data for visits from Germany. Don't forget to turn on filtering by using the "Toggle quick filter" button after the setup. Selected Instant filter box allows you to select already defined instant filter. You are adding such filters
by using Data filtersData filters can be used to refine or highlight rows in already generated reports. 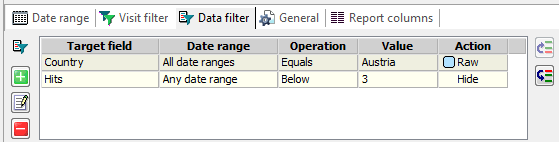
In example you can hide rows, where value in the Hits field is less than 3 or highlight rows (or cells) where Country=Austria with specific color. Data filters are available in favorite reports only. To quickly create data filter right click on a value you are going to filter by and select "Filter report by this value" from the menu. Don't forget to turn on data filters using "Toggle data filter" button. Report columns"Report columns" settings is the place to go if you need to change column names and visibility in your reports. 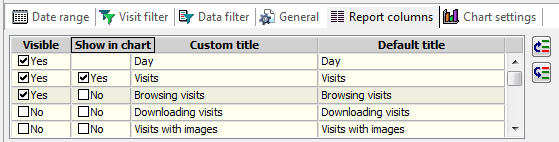
Double click on custom title to change it, use buttons on the right side of the list to change column order, click on check boxes to setup column visibility. Chart settingsYou can setup chart title and some other parameters in the "Chart settings": 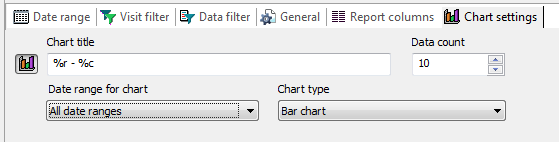
You must select "All date ranges" in the Date range for chart box to be able to select date ranges using "Show in chart" check boxes in the "Date ranges" settings. |
 Tutorials
 How it works
 to add a new report and select appropriate date range from the menu.